
Trade concerns and market uncertainty have plagued investors over the past few weeks. To avoid potential disaster, investors are scrambling to find defensive stocks, dividend payers, and companies that do business domestically.
Thankfully, some industries are entirely uncorrelated with the broader markets, and their underlying stocks move to their own rhythm.
One drug manufacturer is offering investors outsized gains and stable performance regardless of market certainty.
A Best-In-Class Drug Manufacturer and Investor Darling
Novartis AG (NVS) is a $212 billion drug manufacturing and pharmaceutical conglomerate. It is one of the largest multinational companies of its kind in the world. Its drug portfolio holds numerous generic and well as proprietary labels under its umbrella and treats a wide range of illnesses and disorders.
The company reported a first-quarter earnings beat of $1.21 per share compared to the analysts’ estimates of $1.16 per share. Revenues rose 2% year-over-year to $11.1 billion. Management upped guidance for 2019 as well in net sales and operating income expectations.
The company’s latest gene therapy drug, Zolgensma, noted for being the most expensive drug treatment in the world at more than $2 million, received FDA approval. This helped propel the stock higher.
Consequently, the stock saw two upgrades. Both Liberum and Guggenheim changed their recommendations from “neutral” or “hold” to “buy” signaling to investors that Wall Street is paying close attention to the stock’s potential.
Fundamental Analysis of NVS
The stock trades cheaply at just 16 times earnings compared to the industry average of 28 times earnings. This gives the appearance of a value pick-up for investors. The stock’s most attractive feature is its 3.20% dividend yield. This yield should help boost annual returns as well as protect investors from downside movement. The dividend payout ratio of just 55% means that the company has plenty of room to raise the dividend down the road.
Technical Analysis of NVS
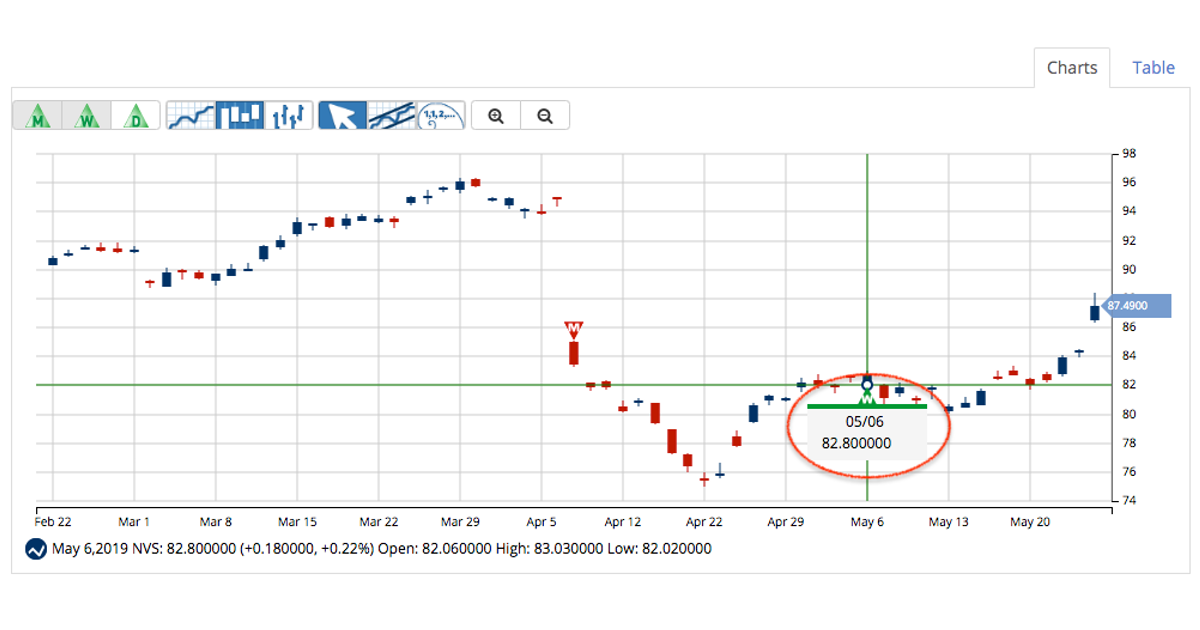
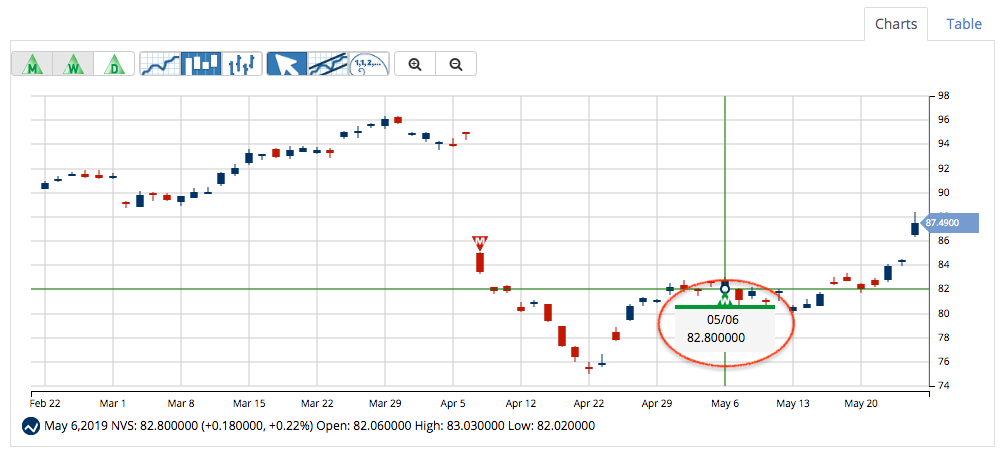
Novartis’ chart shows a clear trough with growing momentum lifting the stock higher. The gap between the longer 90-day SMA and the shorter 20-day SMA is narrowing fast. It looks like NVS appears to be well on its way to crossing over in the next week or two. That could help add even more bullish momentum to the stock and boost the stock price to even higher levels.
The Bottom Line
Based on Novartis’ full-year EPS estimates, this stock should be fairly valued at around $110 per share – a gain of about 30% with the dividend reinvested. Investors looking for a performance stock that doesn’t follow along with the average market trends will find that Novartis is a bargain buy that fits the bill.
The above analysis for NVS was provided by Daniel Cross, professional trader and financial writer.
MarketClub’s Analysis for NVS
MarketClub detects some long-term weakness for NVS. However, a new weekly Trade Triangle is a positive sign that NVS is making a move to the upside.
In early April, Novartis experienced a significant gap down, falling from $94.90 to $83.66. After touching down to a 6-month low on April 22nd, NVS has since rebounded.

NVS is currently showing only a +60 Chart Analysis Score. While short and intermediate-term strength builds, the long-term trend is still pointing in a downward direction.
MarketClub members will be the first to know when the long-term Trade Triangle confirms a steady, positive trend for NVS.
Don’t miss the next move for Novartis AG (NVS). Become a MarketClub member today to get signals and alerts for NVS and analysis for over 350K other stocks, ETFs, futures, forex or mutual fund symbols.